Walk onto any solar installation and you will hear people throw around numbers: “400 watts,” “22% efficient,” “-0.29% per degree.” These numbers appear on every datasheet, but few buyers — and even some installers — truly understand what they mean. A 400 W solar panel rarely produces 400 W in the field. That is not a flaw. It is physics.
This guide breaks down the five most important solar panel specifications: rated power, efficiency, temperature coefficient, power tolerance, and degradation rate. By the end, you will know exactly what those datasheet numbers mean — and which ones actually matter for your installation.
1. Rated Power and Standard Test Conditions (STC)
Every solar panel carries a wattage rating — 400 W, 550 W, or even 700 W. This number is called the rated power or watt-peak (Wp) rating. It tells you the maximum DC power the panel can deliver under a very specific set of laboratory conditions.
1.1 What Are Standard Test Conditions?
Standard Test Conditions (STC) are a fixed set of laboratory parameters used to rate and compare solar panel output under identical, repeatable conditions. Every reputable module datasheet reports its power rating at STC, allowing buyers to compare panels from different manufacturers on a level playing field.
The three STC parameters are:
-
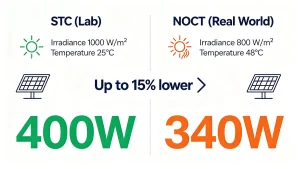
Irradiance: 1,000 W/m² — equivalent to bright noon sunlight perpendicular to the panel
-
Cell temperature: 25°C — far cooler than most panels operate in the field
-
Air mass: AM1.5 — the spectral distribution of sunlight at roughly 48° solar elevation
1.2 Why STC Ratings Are Misleading
A panel at STC receives 1,000 W/m² of light and stays at 25°C. In practice, a rooftop panel in Phoenix at noon can reach 65–70°C even when ambient air is 40°C. That temperature rise alone can cut output by 12–18%. The 450 W on the label is a laboratory number, captured at a cell temperature that almost never exists outside a flash tester.
STC ratings are a benchmark, not a field performance guarantee. Panels in hot climates regularly operate at 50–70°C cell temperatures, which can reduce output by 10–20% compared to the STC rating.
1.3 More Realistic Ratings: NOCT and NMOT
To bridge the gap between lab and field, manufacturers also report performance under Nominal Operating Cell Temperature (NOCT) or NMOT (the updated standard). NOCT tests the panel at 800 W/m² irradiance, 20°C ambient air, and 1 m/s wind. The resulting cell temperature is typically 45–48°C. NOCT power is usually 10–15% lower than STC power.
When sizing a system, always use NOCT or PTC (PVUSA Test Conditions) ratings rather than STC. STC is for marketing comparison; NOCT is for real-world design.
2. Efficiency: What It Means and Why It Matters
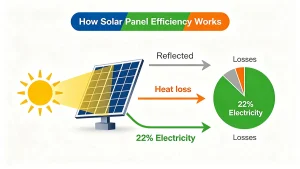
Solar panel efficiency is the percentage of sunlight hitting the panel surface that converts to usable electricity under STC. A 22% efficient panel converts 220 W of every 1,000 W per square meter into electricity.
2.1 Cell Efficiency vs. Module Efficiency
Two distinct metrics appear in manufacturer data:
-
Cell efficiency measures a single solar cell in isolation, excluding frame, busbars, and inactive surface area. A high-efficiency TOPCon cell might reach 26–27% in laboratory conditions.
-
Module efficiency applies to the entire assembled panel — cells plus glass, encapsulant, backsheet, and frame — and runs consistently lower due to inactive area and optical losses. Module efficiency is typically about 2% lower than cell efficiency.
The practical metric for system design is power density: watts per square meter (W/m²). Two panels can carry identical efficiency ratings but different power outputs if one uses a larger format.
2.2 Where Efficiency Stands in 2026
The average residential solar panel shipped in 2024 was 20% efficient. The most efficient solar panels in 2026 now break 25% — a threshold the industry spent two decades approaching. One percentage point of efficiency gain translates to roughly 4 fewer panels on a 10 kW system.
In June 2026, JinkoSolar launched its Tiger Neo 5.0 module delivering up to 700 W of output with a module efficiency of 25.91% and power density exceeding 259 W/m². The panel uses a high-purity homogeneous silicon substrate, broad-spectrum light-trapping structure, and full-area passivation.
TOPCon dominates volume production with top models at 23.8–24.0% efficiency. Premium HJT panels carry the best temperature coefficients but cost 10–15% more than TOPCon.
2.3 When Efficiency Matters Most
Premium efficiency is worth paying for only when roof space is the binding constraint. If you have ample roof area, a slightly less efficient panel with a better price per watt may deliver better overall value. If your roof is small or shaded, higher efficiency panels allow you to maximize generation from limited space.
3. Temperature Coefficient: The Hidden Performance Killer
The temperature coefficient is one of the most important specifications for predicting actual energy production. It measures how much power a panel loses for every degree Celsius above the 25°C STC baseline.
3.1 How It Works
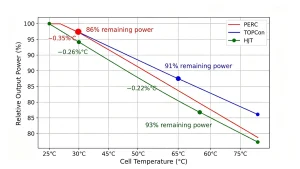
The temperature coefficient is labeled “Temp. Coeff. of Pmax” or “γPmax” on spec sheets. It is always negative for power and voltage. A coefficient of -0.35%/°C means the panel loses 0.35% of its rated power for each degree over 25°C.
Solar panels lose 0.3–0.5% of rated output per °C above 25°C. On a summer day with panel temperatures reaching 65°C, that is a 12–20% power loss before any other derating. A 400 W panel often delivers only 320–340 W on a clear summer afternoon in Phoenix or Dubai.
3.2 Technology Comparison
Different cell technologies have different temperature coefficients:
| Technology | Temperature Coefficient (Pmax) |
|---|---|
| PERC | -0.35% to -0.38%/°C |
| TOPCon | -0.26% to -0.29%/°C |
| HJT | -0.22% to -0.24%/°C |
At a 45°C cell temperature (20°C above STC), a PERC panel loses about 7% of its rated output. An HJT panel at -0.24%/°C loses only about 5% under the same conditions. HJT panels outperform standard mono-PERC by 5+ percentage points in hot conditions.
JinkoSolar’s Tiger Neo 5.0, for example, has a temperature coefficient of -0.26%/°C. Canadian Solar’s TOPCon 3.0 module achieves -0.26%/°C through advanced passivation technologies applied to the cell edge and surface. Trina Solar’s 485 W TOPCon panel also carries a -0.26%/°C coefficient.
3.3 Why It Matters for Your Location
If you live in a hot climate, the temperature coefficient may be more important than the STC efficiency rating. A panel that is 1% less efficient at STC but has a 0.05%/°C better temperature coefficient can outperform the more efficient panel over 25 years in a hot region. HJT panels, with their superior temperature coefficients, are particularly well-suited for hot climates.
4. Power Tolerance: What You Actually Get
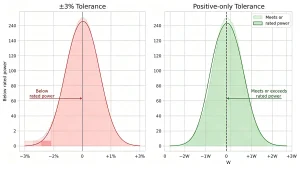
Power tolerance tells you how much the actual output of a panel can deviate from its rated power. It is expressed as a range — for example, 0 W to +3 W, or ±3%.
4.1 Positive vs. Bimodal Tolerance
Premium manufacturers often specify a positive-only power tolerance, such as 0 W to +3 W. This means every panel in the production batch will deliver at least its rated power, and some will deliver slightly more. Budget panels often carry a bimodal tolerance like ±3%, meaning some panels may deliver 3% less than their rated power.
4.2 Why It Matters
A 400 W panel with a -3% tolerance could deliver as little as 388 W. A 400 W panel with a 0 W to +3 W tolerance will deliver at least 400 W. Over a 10 kW array (25 panels), that difference can add up to hundreds of watts of lost capacity. Always check the power tolerance before purchasing — positive-only tolerance is a sign of quality manufacturing.
5. Degradation Rate: How Panels Age
Solar panels do not maintain their rated output forever. Every year, they lose a small percentage of their generating capacity. This loss is called degradation.
5.1 Degradation Rates by Technology
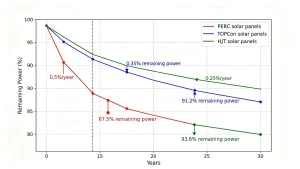
Solar panel degradation rates in 2026 vary significantly by technology:
| Technology | Annual Degradation Rate |
|---|---|
| PERC | 0.45–0.55% per year |
| TOPCon | 0.30–0.40% per year |
| HJT | 0.25–0.35% per year |
The NREL median degradation rate for PV modules is 0.5% per year. Modern systems using N-type cell architectures push the low end of the distribution down to 0.25–0.30% per year.
5.2 What Warranties Guarantee
Most solar panels carry 25–30 year performance warranties guaranteeing 80–87.5% of rated output. Tier-1 manufacturers guarantee 80–85% output after 25 years.
JinkoSolar’s Tiger Neo 5.0 guarantees first-year degradation of no more than 1% and annual linear degradation of 0.35%. A 30-year warranty with 0.4%/year degradation yields more lifetime energy than a 25-year warranty with 0.55%/year degradation.
5.3 Climate Matters
Degradation is not uniform across climates. Hot climates see system-level degradation around 0.88%/year versus 0.5%/year in temperate zones. The financial cost of degradation over 25 years is roughly 6–8% of total cumulative revenue.
6. Bringing It All Together
When comparing solar panels, do not look at just one number. Here is a practical checklist:
-
Rated power (STC) — use it for comparing panels, but not for production estimates
-
NOCT or NMOT rating — use this for real-world production modeling
-
Efficiency — prioritize only if roof space is limited
-
Temperature coefficient — critical in hot climates; check the Pmax coefficient
-
Power tolerance — prefer positive-only tolerance
-
Degradation rate — lower is better; N-type panels outperform P-type
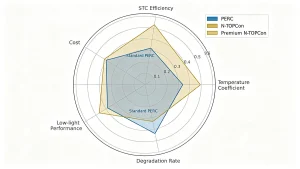
A panel with slightly lower STC efficiency but better temperature coefficient and lower degradation will often outperform a higher-efficiency panel over 25 years. Read the full datasheet, not just the headline numbers.